Common Pitfalls to Avoid When Working With AUC ROC Curve – 2024 Guide

When working with machine learning models, evaluating their performance is critical to determine their accuracy and effectiveness. One of the most commonly used metrics is the Area Under the Receiver Operating Characteristic (AUC ROC) curve, which measures the model’s ability to distinguish between positive and negative classes. However, working with the AUC ROC curve can be tricky, and there are several common pitfalls that data scientists and machine learning practitioners should avoid. In this article, we will discuss some of these pitfalls and how to avoid them.
Understanding the AUC ROC Curve
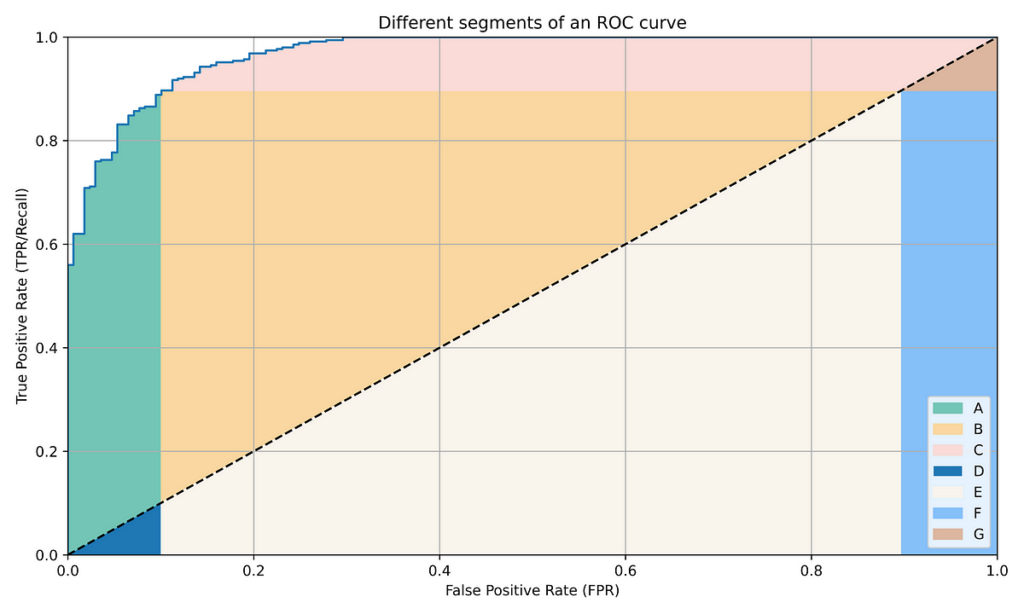
The AUC ROC curve is a graphical representation of a binary classifier’s performance, showing how well it can distinguish between positive and negative samples. The curve plots the true positive rate (TPR) against the false positive rate (FPR) at different classification thresholds. The area under the curve is a measure of the classifier’s overall performance, with a higher value indicating better accuracy.
Common Pitfalls to Avoid
1. Using the AUC ROC Curve as the sole metric for model evaluation
The AUC ROC curve is a useful metric, but it should not be the only one used for model evaluation. There are other metrics that can provide additional insights, such as precision, recall, F1 score, and accuracy. Relying solely on the AUC ROC curve can lead to inaccurate conclusions about a model’s performance.
2. Ignoring class imbalance
Class imbalance occurs when the number of samples in one class is significantly higher than in the other. This can lead to biased AUC ROC curve results, as the classifier may be better at predicting the more frequent class. To avoid this, data scientists should balance the dataset by either oversampling the minority class or undersampling the majority class.
3. Not considering the business problem

The AUC ROC curve should always be considered in the context of the business problem being addressed. For example, if the cost of a false positive prediction is much higher than the cost of a false negative, then the optimal operating point for the AUC ROC curve may be different than if the costs were reversed.
4. Overfitting the model
Overfitting occurs when a model is trained on the training data to the point where it fits the data too closely, resulting in poor generalization to new data. This can result in a high AUC ROC score for the training data but poor performance on the validation or test data. To avoid overfitting, data scientists should use regularization techniques, such as L1 or L2 regularization, or use cross-validation to assess the model’s performance on unseen data.
Conclusion
The AUC ROC curve is a powerful tool for evaluating binary classifiers’ performance, but there are several common pitfalls that data scientists and machine learning practitioners should avoid. By considering the business problem, balancing the dataset, using multiple evaluation metrics, avoiding overfitting, and selecting the right algorithm and features, data scientists can ensure that their AUC ROC curve accurately reflects their model’s performance. With these tips in mind, data scientists can confidently use the AUC ROC curve to evaluate their models and make informed decisions.